
Yes, candle making can be profitable, but real profit depends on unit cost, selling price, fees, labor, and overhead.
Candle making can show healthy margins on paper, but paper margins are not the same as take-home profit. A candle that looks profitable at first can shrink fast once fees, failed batches, packing supplies, and your time are counted. The math also changes when you sell through Etsy, Shopify, craft fairs, or wholesale instead of direct local orders. Looking at cost, price, labor, channel mix, and break-even together gives a more honest view of what a candle business can really make.
Is Candle Making Profitable? Real Monthly Profit Scenarios
Yes, candle making can be profitable, but real monthly profit only appears when price, cost, fees, labor, and overhead are counted together.
Candle making can produce a real monthly surplus, but the numbers are usually smaller than revenue screenshots make them look. If you are weighing candles inside a broader candle business, the better question is not “Can candles sell?” but “What is left after each candle pays for cost, selling fees, overhead, and your time?” Gross profit is what remains after product cost and direct selling fees. Operating profit is what remains after monthly overhead. Owner-paid profit is the stricter version because it also counts your labor.
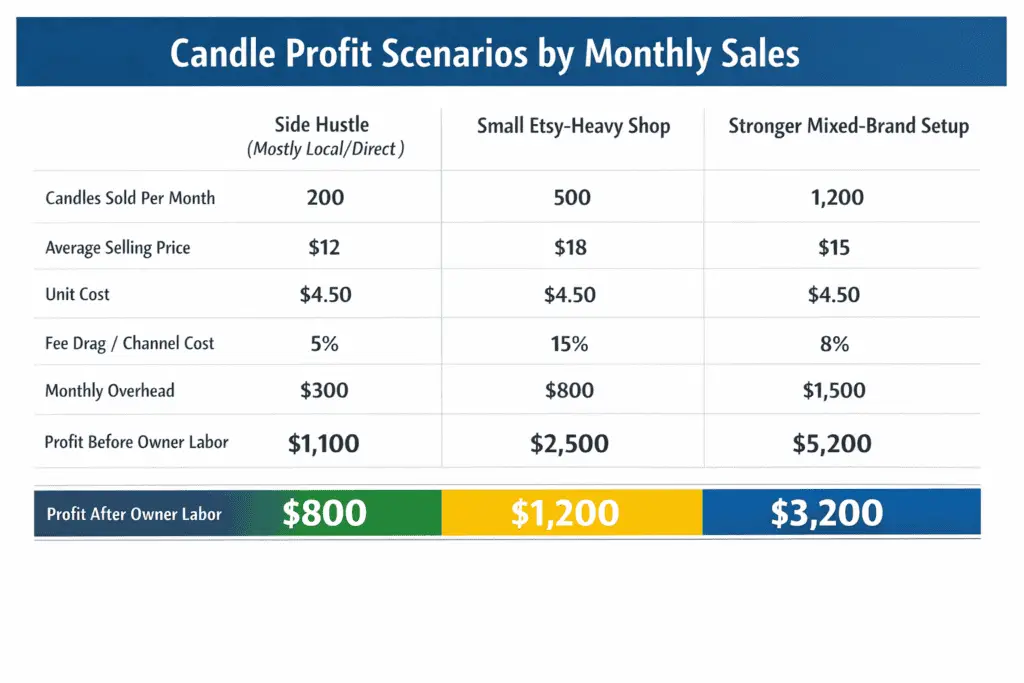
| Modeled scenario | Candles sold / month | Avg. selling price | Unit cost | Fee drag / channel cost | Monthly overhead | Monthly profit before owner labor | Monthly profit after owner labor |
|---|---|---|---|---|---|---|---|
| Side hustle, mostly local/direct | 40 | $22.00 | $5.75 | $1.25 | $75 | $525 | $385 |
| Small Etsy-heavy shop | 100 | $24.00 | $5.75 | $4.25 | $180 | $1,220 | $920 |
| Stronger mixed-brand setup | 180 | $26.00 | $5.75 | $2.75 | $350 | $2,800 | $2,350 |
These are modeled, pre-tax examples, not earnings promises. They assume a standard jar candle in the cost band used later in this article, include recurring product cost plus modeled channel drag, and treat monthly overhead separately from per-candle cost. The “after owner labor” column also assigns a basic labor cost to the month, while the scenarios do not include income tax, paid ads, or one-off startup tools. That is why two sellers with similar jars and scents can report very different monthly results. One common mistake is treating revenue as profit when revenue still has to absorb cost, fees, and fixed expenses.
Method note: these figures are scenario models built from the sample price, cost, fee, overhead, and labor inputs used on this page. Replace those inputs with your own numbers before treating them as a target.
A fast way to read the table is this: a candle business often looks decent before labor, then becomes merely okay once labor is counted. That does not mean the business is bad. It means the math needs to be honest. A side hustle selling 40 candles a month can still make money, but it may behave more like supplemental income than a full replacement income. A shop moving 100 to 180 candles a month can look healthier, yet the result still depends on take-home margin, not just order count.
The next step is to test whether your own numbers are close to these examples. That starts with true per-candle cost, then moves into pricing, fee drag, and break-even.
What It Costs to Make One Candle
A candle is only truly profitable when you know its full recurring cost per jar and keep startup tools separate from per-unit cost.
The first cost question is simple: what does one finished candle cost to make, ready to sell? Cost of goods sold, or COGS, is the recurring cost to make one finished candle ready for sale. For a standard 8 oz jar candle, that usually means wax, fragrance oil, vessel, wick, label, outer packaging, and the packing materials that move with each sale.
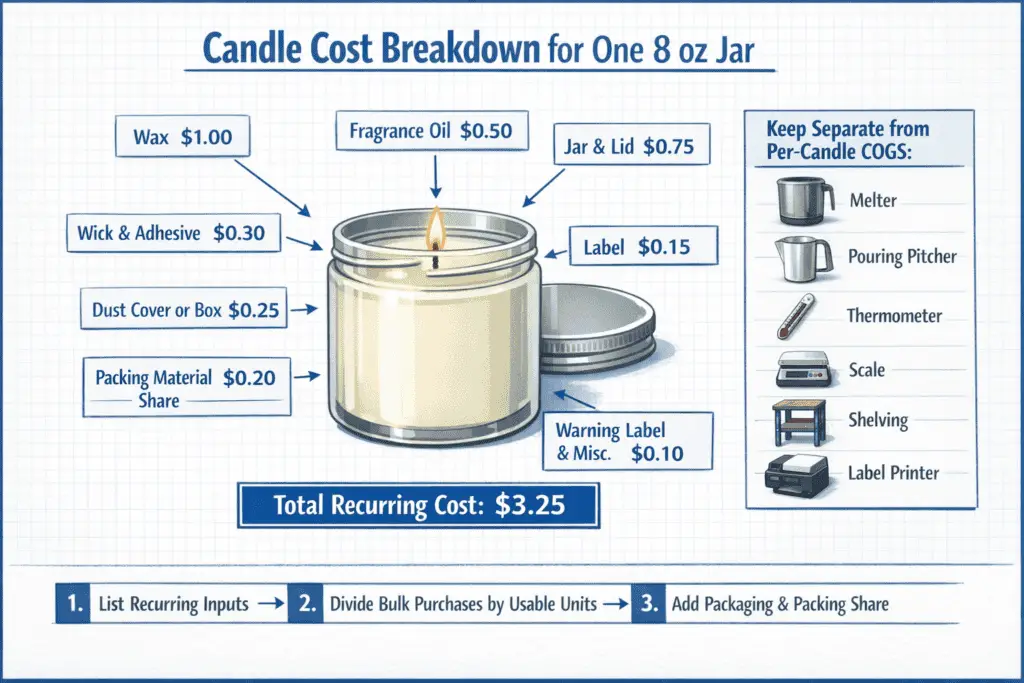
| Recurring input for one 8 oz candle | Modeled cost |
|---|---|
| Wax | $1.73 |
| Fragrance oil | $1.00 |
| Jar + lid | $1.60 |
| Wick + adhesive | $0.22 |
| Label | $0.18 |
| Dust cover or box | $0.52 |
| Packing-material share | $0.40 |
| Warning label / misc. consumables | $0.10 |
| Total recurring cost per candle | $5.75 |
That $5.75 is a better starting point than “my wax was cheap” because it captures the full recurring build. What does not belong in this number is just as important. Your melter, pouring pitcher, thermometer, scale, shelving, and label printer are not per-candle COGS unless you are deliberately allocating them later as overhead or startup recovery. Mixing those one-time tools into per-jar cost makes the candle look worse than it is. Ignoring recurring packaging makes it look better than it is. This model also excludes tax, outbound shipping labels, and losses from testers or failed batches, which should be tracked separately when you move from clean COGS to real profit.
Method note: this cost model is a worked example for one standard 8 oz jar candle using the line items shown in the table. Replace each input with your own wax, fragrance, vessel, label, and packaging costs before using it as a profit baseline.
A quick way to calculate your own number is to use three steps, or a simple candle cost of goods calculator if you want the math in one place:
- List every recurring input that leaves with the candle or is consumed to make it.
- Divide each bulk purchase by usable units, not by the package name on the invoice.
- Add a realistic share for packaging and order packing before you judge margin.
| Candle setup | What changes | Modeled recurring cost |
|---|---|---|
| Basic tumbler, simple packaging | Lighter vessel and minimal outer packaging | $4.95 |
| Standard 8 oz jar | Balanced vessel, label, and giftable packaging | $5.75 |
| Premium gift-style candle | Heavier vessel, upgraded box, higher packaging cost | $7.35 |
This is why “candle making is profitable” is never a useful answer by itself. A $22 candle built at $4.95 behaves very differently from a $22 candle built at $7.35. Cost alone does not tell you the final profit story, but it sets the floor under every price decision that comes next.
Selling Price vs Gross Margin
Yes, the same candle can swing from thin to strong gross profit simply because of price band, even when the cost to make it stays the same.
A candle that sells well is not automatically a profitable candle. Gross margin is the money left after product cost is removed from the selling price, while markup measures how much you added above cost, and net profit is what remains after fees, overhead, and labor are taken out too. Candle pricing works best when you separate variable cost, fixed cost, and total cost before judging whether the sticker price is actually doing enough work.
Using the same modeled $5.75 cost from the earlier section, here is what changes when only the selling price changes:
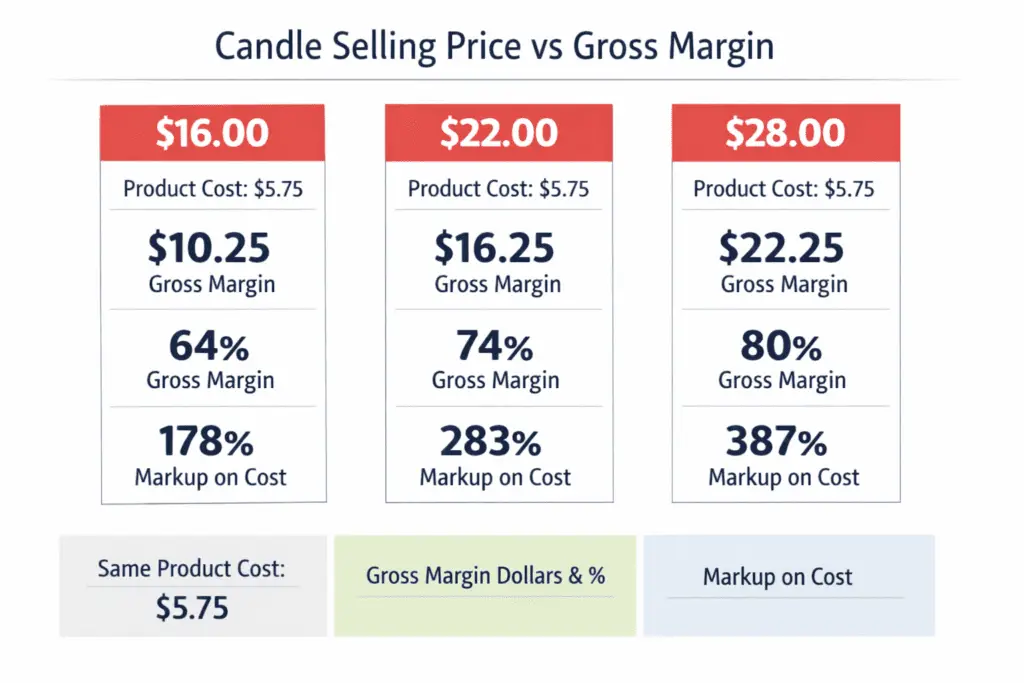
| Selling price | Product cost | Gross margin dollars | Gross margin % | Markup on cost |
|---|---|---|---|---|
| $16.00 | $5.75 | $10.25 | 64.1% | 178.3% |
| $22.00 | $5.75 | $16.25 | 73.9% | 282.6% |
| $28.00 | $5.75 | $22.25 | 79.5% | 387.0% |
The table shows why revenue alone is a weak signal. The $16 candle is still above cost, but it leaves far less room for promos, free-shipping absorption, breakage, or owner pay than the $22 or $28 version. A mid-price candle can look fine at checkout and still feel tight later if you run discounts often or quietly cover part of shipping. That is why two makers with similar jars and similar scents can report very different results even when their sales volume looks close.
Method note: this margin table changes only selling price while holding the modeled $5.75 product cost constant. Use it to see price sensitivity, not as a universal profit benchmark for every candle setup.
A simple pricing rule helps here: first cover cost, then make sure the remaining margin can survive ordinary friction. If you need a fuller framework for pricing handmade candles, start with cost and then stress-test the margin against discounts, packaging, and fees. If a candle is priced so tightly that one promo, one damaged order, or one packaging upgrade changes the month from decent to disappointing, the price band is doing too little. In other words, gross margin is not just about clearing cost once. It is about leaving enough space for the real business to happen.
Common Pricing Errors
- Copying a competitor’s price without knowing whether their jar, fragrance load, packaging, or volume discount structure is different.
- Confusing markup with margin and assuming they mean the same thing.
- Forgetting that bundles, seasonal discounts, and shipping absorption all compress paper margin fast.
How Sales Channels Change Your Take-Home Profit
The same candle can lose very different amounts to channel costs, so take-home profit changes even when the selling price stays the same.
For a candle seller, channel math matters because where the sale happened changes what you keep. The easiest beginner method is to convert every channel cost into dollars per candle, then divide by the selling price to get a take-rate.
The comparison below uses one modeled candle with a $5.75 product cost, and the channel costs are illustrative rather than universal fee schedules because marketplace, payment, and event economics vary by geography, plan, and sell-through.
Here, Shopify allocates a basic monthly plan across 100 orders, the craft fair example spreads a $120 booth fee across 30 candles sold, and wholesale is shown at a $12 reseller price because wholesale should not be read like direct-to-consumer retail.
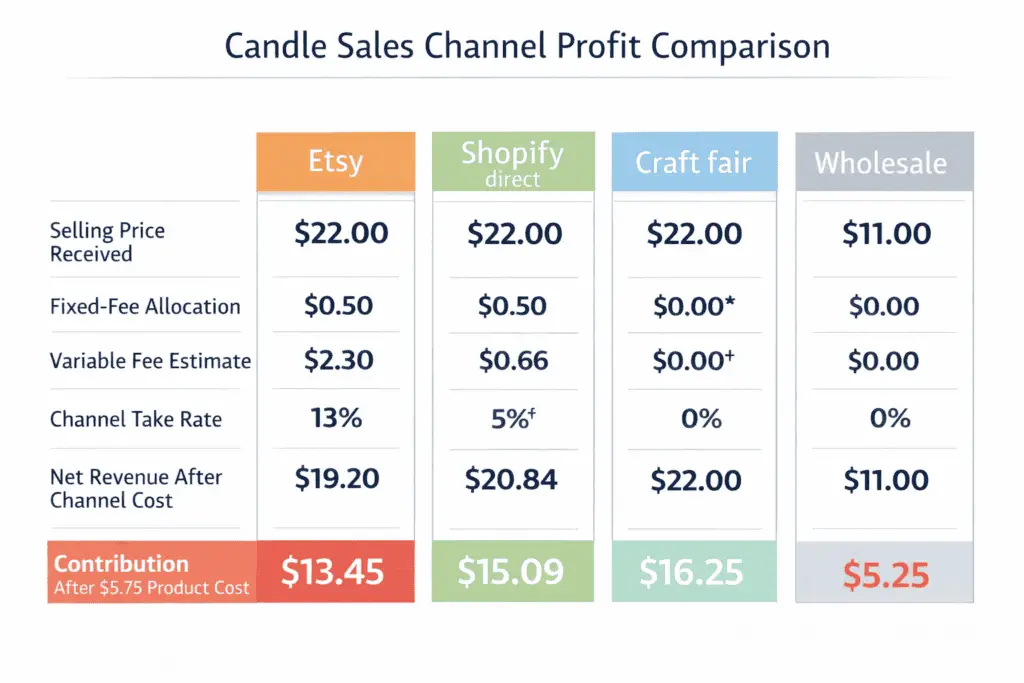
| Channel | Selling price received | Fixed-fee allocation | Variable fee estimate | Channel take-rate | Net revenue after channel cost | Contribution after $5.75 cost |
|---|---|---|---|---|---|---|
| Etsy | $24.00 | $0.20 listing | $2.51 | 11.3% | $21.29 | $15.54 |
| Shopify direct | $24.00 | $0.29 plan allocation | $1.00 | 5.4% | $22.71 | $16.96 |
| Craft fair | $24.00 | $4.00 booth allocation | $0.72 | 19.7% | $19.28 | $13.53 |
| Wholesale | $12.00 | $0.00 | $0.25 admin / ops | 2.1% | $11.75 | $6.00 |
This is why top-line revenue can mislead. Direct orders may keep more per candle when order volume is steady enough to spread monthly platform cost. Craft fairs can look great when sell-through is high, but a weak event makes booth allocation expensive fast. Wholesale usually produces a lower per-unit contribution, yet it may still help cash flow if it moves volume predictably.
The key comparison is not just “Which channel has fees?” It is “How much total channel drag does one candle carry here?” That single question makes channels comparable without turning the decision into guesswork. It also stops a common mistake: assuming that a busy booth or a full Etsy order log automatically means stronger take-home profit.
Break-Even: How Many Candles You Need to Sell
Break-even depends on contribution margin per candle, not revenue alone, so a candle business becomes meaningfully profitable only after each candle’s remaining margin fully covers fixed monthly overhead.
In plain English, break-even means the number of candles you must sell before the month stops merely paying bills and starts producing real surplus. Fixed overhead is the cost that stays even if you sell nothing that week, such as website software, workspace allocation, insurance, bookkeeping, equipment recovery, or market fees that are already committed. Contribution margin is what one candle contributes toward those fixed costs after variable cost and selling-channel drag are removed. That is why a $24 candle does not help break even by $24. It only helps by whatever is left after cost and channel expenses are taken out.
The simple formula is:
Break-even candles sold = fixed monthly overhead ÷ contribution margin per candle
This operating break-even point does not recover startup-tool purchases, taxes, or ad spend unless you deliberately add them into overhead first.
In simple math using the same modeled numbers from earlier sections:
Contribution margin per candle = selling price − recurring product cost − channel cost
Contribution margin per candle = $24.00 − $5.75 − $2.25 = $16.00
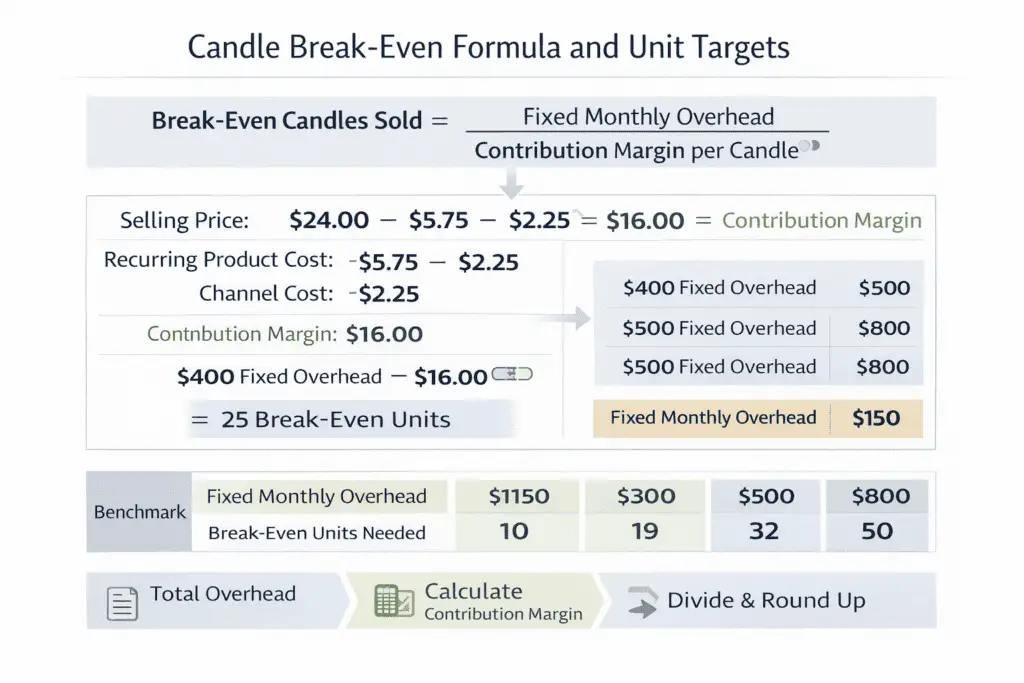
| Monthly overhead | Contribution margin per candle | Break-even candles needed |
|---|---|---|
| $150 | $16.00 | 10 |
| $300 | $16.00 | 19 |
| $500 | $16.00 | 32 |
| $800 | $16.00 | 50 |
That table shows why many small candle shops can reach break-even faster than beginners expect, but only when the contribution margin is real and overhead stays controlled. A business with modest fixed costs may only need to sell around 10 to 20 candles a month to stop losing money at the operating level. A business with heavier monthly commitments, slower-moving inventory, or more expensive packaging may need far more volume before the month feels truly profitable. The difference is rarely “Do candles sell?” It is usually “How much does each candle really contribute after the obvious and non-obvious deductions?”
A good three-step method keeps the math honest:
- Total your true monthly fixed overhead without mixing in per-candle material costs.
- Calculate contribution margin using your actual price, recurring unit cost, and average selling-channel drag.
- Divide overhead by contribution margin and round up to the next full candle, because you cannot sell a fraction of a finished order.
| Scenario | Selling price | Product cost | Channel cost | Contribution margin | Monthly overhead | Break-even units |
|---|---|---|---|---|---|---|
| Mostly direct/local sales | $24.00 | $5.75 | $1.00 | $17.25 | $300 | 18 |
| Etsy-heavy mix | $24.00 | $5.75 | $2.75 | $15.50 | $300 | 20 |
| Premium price, higher overhead | $28.00 | $5.75 | $2.75 | $19.50 | $500 | 26 |
How to Calculate Profit Per Candle With Your Own Numbers
Use one line of math: selling price − recurring product cost − average channel cost − labor cost per candle = owner-paid profit per candle.
Then multiply that result by expected monthly units to estimate monthly owner-paid profit before tax, and compare the total with your monthly overhead. If the per-candle result is positive but the monthly total still does not clear overhead, the candle works at the unit level but the business is not yet operating-profit positive.
This is why break-even should always be read alongside pricing and channel choice. A small improvement in price or a small reduction in fee drag can lower the number of candles you must sell each month more than many makers expect. The reverse is also true. If your overhead rises, or your contribution margin slips because of discounts, shipping absorption, or upgraded packaging, the break-even point climbs quickly.
One more reality check matters: hidden losses raise the true threshold. Failed pours, testers, damaged jars, leakage, and returns do not always show up in a clean spreadsheet at first, but they reduce what each sellable candle actually contributes. So break-even math is best treated as a living number, not a one-time estimate. Rechecking it monthly keeps the business grounded in what the numbers are really doing rather than what revenue alone suggests.
What Changes When You Pay Yourself for Labor
A candle business can look profitable on paper but become much thinner once owner time is included.
The easiest way to price your own labor is to convert batch time and order-handling time into a per-candle cost. Hobby-style margin counts materials and maybe platform fees, while owner-paid margin also counts pouring, curing setup, labeling, packing, and order admin. That is why selling price vs gross margin is only the first layer of the math. Once labor is added, break-even usually moves higher, and many of the earlier profit scenarios look more conservative.
| Task in one 24-candle batch | Time |
|---|---|
| Wax prep, pouring, cleanup | 90 minutes |
| Wicking, labeling, finishing | 45 minutes |
| Packing, order handling, admin | 35 minutes |
| Total batch labor | 170 minutes |
If you value your time at $20 per hour, 170 minutes equals 2.83 hours, or about $56.60 in labor for the batch. Spread across 24 candles, that adds about $2.36 in labor cost per candle.
| Example for one candle | Amount |
|---|---|
| Selling price | $22.00 |
| Recurring product cost | $5.75 |
| Gross margin before labor | $16.25 |
| Labor cost per candle | $2.36 |
| Margin after labor, before channel fees | $13.89 |
This does not mean a candle business is unworkable. It means owner-paid profit is the more honest version of profit when you want to know whether the business is merely busy or actually worthwhile. A useful habit is to track the last two or three real batches before changing prices, because most makers underestimate how much time labeling, boxing, and order handling really take.
Hidden Losses That Cut Real Candle Profit
Real candle profit is usually lower than spreadsheet profit because failed pours, testers, breakage, and returns quietly raise the true cost of every sellable candle.
Clean break-even math assumes every candle made becomes a full-price sale, but real operations rarely work that way. A few bad pours, a handful of tester jars, one broken shipment, or slow-moving stock marked down at the end of a season can change the month more than beginners expect. That is why break-even should be treated as a moving threshold, not a perfect fixed number. It also connects back to per-candle cost, because hidden losses increase the effective cost of each finished candle.
| Common loss category | Example rate | Modeled monthly profit drag per sellable candle |
|---|---|---|
| Test pours and failed batches | 4% | $0.23 |
| Damaged jars or lids | 2% | $0.12 |
| Shipping breakage or returns | 1.5% | $0.18 |
| Discounted slow inventory | 3% | $0.17 |
| Total hidden loss drag | $0.70 |
Using the earlier modeled cost of $5.75, a hidden-loss drag of $0.70 raises the effective cost to about $6.45 per candle. That difference looks small at first, but across 100 candles it removes $70 from the month before tax. It also pushes the true break-even point upward because each candle contributes less than the clean model suggests.
Method note: these loss rates are illustrative placeholders, not standard industry failure rates. Replace them with your own tester, damage, return, and markdown history to estimate your real drag per sellable candle.
A practical fix is to keep a simple monthly loss log with three columns: what was lost, how often it happened, and what it cost. Once those events are visible, the profit picture becomes more realistic and easier to improve. Many sellers do not have a pricing problem as much as they have an untracked-loss problem.
How Bundles and Repeat Orders Improve Profit
Once unit economics already work, bigger orders and repeat customers can leave more contribution per transaction because packing effort and payment costs are spread across more revenue. That is a secondary profit lever, not the core answer to this page. If the bigger question is how reseller pricing changes the numbers, compare your wholesale vs retail pricing strategy separately.
FAQ: Candle Profitability Questions
Yes, candle making can produce real profit, but the result depends on cost control, price band, channel drag, labor, and overhead rather than revenue alone.
The quick answers below cover the follow-up questions that usually decide whether candle making stays a side-income project or becomes a stronger business.
Can You Make a Living Selling Candles?
Some sellers do, but many small makers reach supplemental-income results first. A living income usually requires enough monthly volume and pricing power for profit to survive fees, overhead, and paid owner labor.
What Is a Good Profit Margin on Candles?
Gross margins on candles can look high, but a useful margin is one that still works after channel costs, packaging, overhead, and your own time are counted. That is why owner-paid profit is a better decision metric than gross margin alone.
Is Etsy Profitable for Candle Sellers?
Etsy can be profitable when the selling price and conversion rate are strong enough to absorb marketplace costs, but the same candle usually keeps less than a direct order. It is often best read as a demand channel, not automatically the highest-margin channel.
How Many Candles Do You Need to Sell Each Month to Make Money?
There is no universal number because break-even depends on contribution margin and fixed overhead. In the modeled examples here, modest overhead and a $16 contribution margin produced break-even points from about 10 to 50 candles per month.